Storytelling with data - part 2
This is the second part of my notes about Storytelling with data. Read part 1.
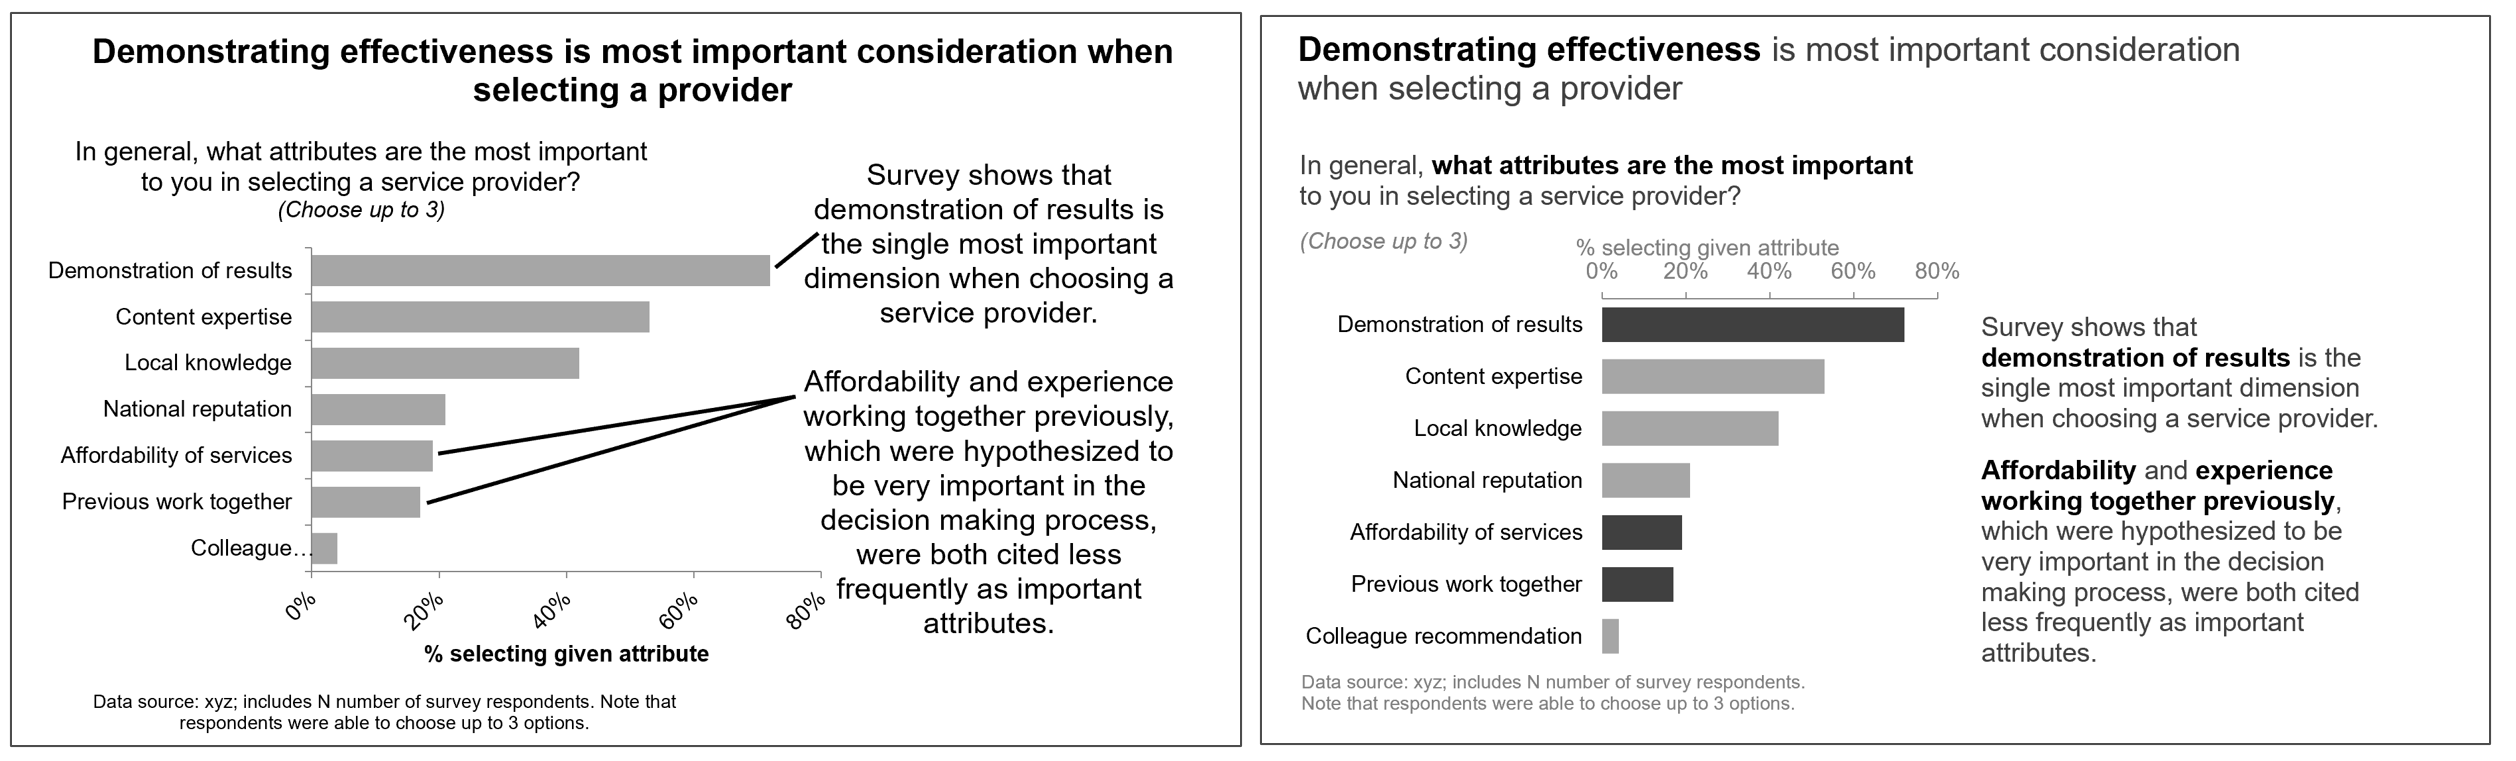
Declutter
- Goal: Minimize perceived cognitive load
- Cognitive load: “How hard do I have to think to understand it”
- Perceived: “What do I think how hard I have to think”
Examples of clutter:
- Long text without focus
- Center aligned text
- Diagonal lines
- Diagonal text in graphs
- No overall order (Z-shape) from top left of the slide
Example of two slides before and after decluttering. The content is identical on both slides.
Focus the Attention
After decluttering the visuals, bring the focus on where you want it and frame the discussion. Examples:
- Color
- Bold
- Contrast
other possible additions:
- Title with call to action
- Clarifying text to avoid misinterpretation
Storytelling
Conventional rhetoric
- Arguments in bullet points
- Tell the facts
- Audience is arguing with me in their heads
What is a story?
- How and why life changes
- Balance -> event –> conflict –> resolution
- Character we care about
Classic three act story
Act 1
- Build context and common ground
- Introduce characters and desires
- Protagonist: your audience
- What is in for me?
Act 2
- Give examples
- Quote external content or people
- Present data
- Tell what happens if we do nothing
- Provide options
- Illustrate the benefits
Act 3
- Reveal what they can do to save the world, tell what you did
- What you want your audience to do
- Tie back to the beginning
Other tools
Repetition Horizontal logic: Read just the titles, does it make sense Vertical logic: Is each slide consistent on its own
More resources:
- http://www.storytellingwithdata.com/blog
- https://data.fivethirtyeight.com
- https://eagereyes.org
- https://www.theguardian.com/data
Image sources: Knaflic, Cole. Storytelling With Data: A Data Visualization Guide for Business Professionals, Wiley, © 2015.